Weather conditions and television use. Smart Home case study
25 janvier 2021Written by Adrian-Nicu Ion
Abstract
This study proposes a graphical analysis over the impact of daily atmospheric weather conditions on daily television use in a regular household equipped with smart sensors. The aim of the study was to investigate the effect of daily weather changes on people consumer habits. It is proposed, considering the mood and mood management theory that inclement and uncomfortable weather conditions are associated with lower human mood and therefore watching entertainment may serve to repair such feelings. Thus, in times of harsh weather conditions the television programs consumption is supposedly increased. It will be studied how data coming from smart sensors can be graphically used to raise awareness over media consumption habits and how they can be used to help users track their activity in a meaningful way. This thesis is put up to test by using real measurements for television usage, temperature, sunshine and rain.
Introduction
It is well known that some elements of weather, foremost temperature and sunshine are important factors that influence the annual cycle in overall levels of television use. TV viewers, on average, tend to watch more television during colder days or days without much sunshine. Using studies conducted in the USA [1] and Netherlands [2] it can be said that the seasonal variation in television viewing peaks are in the winter and during the summer the TV consumption is at its lowest. The seasonal and meteorological nature of television viewing is typically explained by arguing that viewing competes for time with other leisure activities, and therefore people usually tend to watch more television when the amount of daylight and weather conditions are harsher and do not permit them to be outside to do outdoor, warm weather specific activities. So, bad weather reduces the range of recreation and leisure opportunities and can act as a mechanical or perceived barrier for accessibility and mobility to out-of-home leisure opportunities. Television is then the go-to activity for indoors, being the most popular sedentary activity in a household.
The driving philosophy of IoT is to gain knowledge about an environment, state of things, user’s situation and activities. This knowledge is made possible to be acquired by sensors. The sensors, which act as the nervous system of IoT, consistently sense and capture the necessary data from the device itself, the environment, and users. Weather sensors can help the consumer get hyperlocal forecasts, automate things inside the house and get insight information about how weather can change their inside behavior and their house power consumption. Another type of sensors are the ones that monitor different energy consumption parameters for each or for different groups of devices. These sensors help the user to increase efficiency, reduce electrical bills, monitor behaviors and create automation logics.
In this paper, a mix of environmental sensors and energy consumption meters will be used to study behavioral customs in terms of television consumption in different weather settings. It will be seen if the weather influences the television consumption and also a few methods of interacting with the end user will be proposed. As information is nothing if it doesn’t reach the end user graphical statistical panels will be showed that can be implemented further in mobile applications that feed the owner of smart sensor the information about its behavior.
Case study
The driving philosophy of IoT is to gain knowledge about an environment, state of things, user’s situation, and activities. This knowledge is made possible by sensors embedded in the things. The sensors, which act as the nervous system of IoT, consistently sense and capture the necessary data from the device itself, the environment, and users. In general, IoT devices are not intelligent but with the addition of smart sensors, these devices are transformed into smarter ones. Thus, the data gathered by sensors can be analyzed to find hidden patterns and to predict user need, but also notify the user upon certain things.
This paper is proposing a case study about television consumption in regard to outside weather. It is proposed that the user of the smart system wants to analyze his habits in order to take actions according to the results. For this, it must be remembered that the most efficient way to look at data as a normal, not-specialized trained personnel it is by seeing graphical representations of it. Therefore, this study will be focused on analyzing data according to different graphs using one of the most popular software for data visualization, Tableau.
Tableau is a visual analytics platform transforming the way people use data to solve problems – empowering people and organizations to make the most of their data. Tableau products query relational databases, online analytical processing cubes, cloud databases and spreadsheets to generate graph-type data visualizations. The products can also extract, store and retrieve data from an in-memory data engine.
The sensors used were the ones available on the platform, trying to make the most of the present measurements to analyze consumption studies. For television consumption the appliance power sensors were used, making extra considerations and suppositions. To count the television consumption, not in terms by power but in terms of time, the positive values of the consumed power are taken into account. Those values are then counted in a new variable that will give us the number of hours that the television is ON in the household. Since the available measures have a gap of three hours in their snapshots of consumption, it is proposed for the sake of this study to consider that this sensor either measure at hourly frequency, or it takes snapshots whenever the television is ON. Nevertheless, since this study is based on three months of data, 3-hour period is still acceptable to find trends in media usage. The other sensors used are external sensors that measure the amount of rain, the outside temperature and the luminosity.
Firstly, a look at the general TV consumption is proposed. It can be seen that the trend varies with time in the 14 weeks considered for this study. The user has two consumption peaks during the third week of October and the first week of December and two lows in the first week of October and the first week of January.
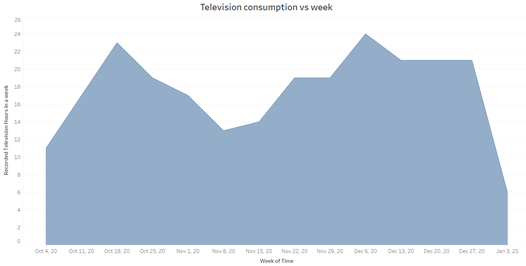
Figure 1 Television consumption per week
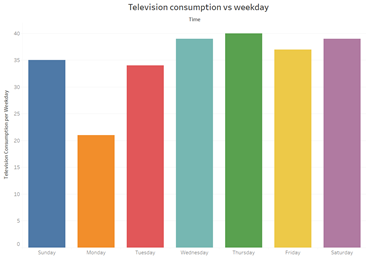
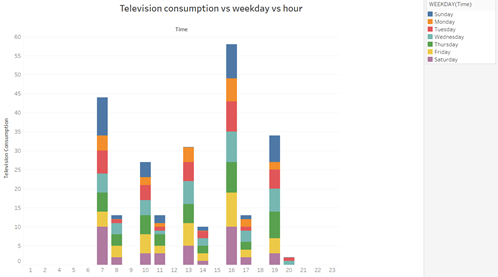
Also, conclusion can be drawn upon the time the user chooses to spend his time at the television in the 3-months data. It can be seen that Monday is the day with the lowest usage, while Thursday and Saturday top the chart.
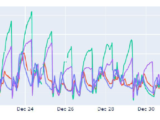
In terms of TV consumption habits hours, it can be seen that on Weekends the consumption is high in the morning and afternoon, while during the week the consumption is preferred mostly at noon and afternoon.
The tested hypothesis is to see if TV consumption varies with external factors. For that, features will be added one at a time and a Pearson Correlation Factor will be calculated for each on of them, to study not only in visual terms, but mathematically the correlation.
Temperature sensor is the first one considered. To study the consumption in terms of week, the average week temperature will be considered. It can be seen that the trend is that the television consumption is increasing when the temperature is decreasing, especially starting from the third week of November. Correlation of these two measurements for this period is small 0.08, but that might be because of the small dataset of 14 datapoints taken for this study and the variability that they have.
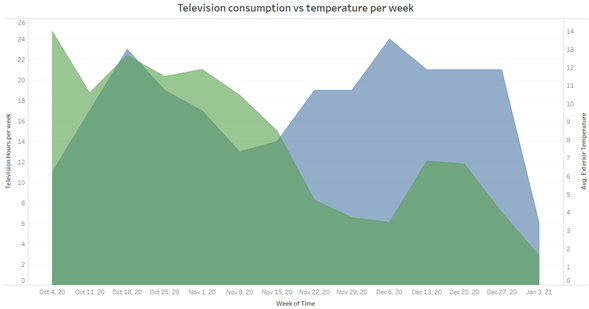
Figure 2 Television consumption vs temperature per week
Another parameter considered is the rain. Due to the way a rain gauge work, it was considered that the average value per day is not relevant anymore, and the sum of the values per week was taken. Even if this not measuring the hours of rain per day or the precipitation quantity, it is a valuable parameter because the rain gauge is recording more values if the rain is persistent during the day, and less values if the hours of rain are fewer. So, the sum of the parameters recorded by the rain gauge are useful to show us a qualitative recording of how much rain was in a week. In the graph below, red stands for rain and blue for television consumption.
Figure 3 Television consumption vs rain per week
If the correlation is computed, a value of 0.5 is obtained, which makes this the most correlated feature with the television consumption in this household.
Luminosity is yet a parameter that is taken into account for the study. The initial presumption is that if the day is sunnier than the television consumption will be lower, as outside activities will be preferred. The average luminosity per week was taken into account and even if we can see a downward trend as winter advances, the television consumption does not appear to be much affected.
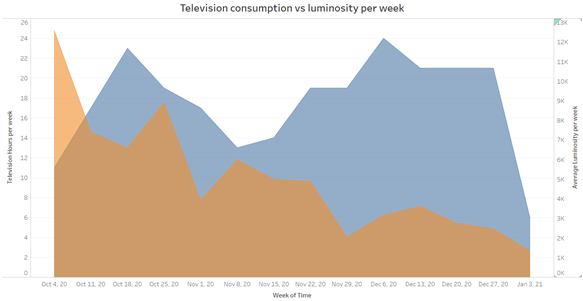
Figure 4 Television consumption vs luminosity per week
If the correlation is computed, a value of 0.04 is obtained, mainly due to the last week on January, that goes against the norm. The value shows that luminosity is not such a big factor as temperature, and it’s not comparable to the rainy days.
Conclusions
The first conclusion that can be drawn from the presented results and graphical representations is that sensors can play a big part of discovering behavioral trends in human habits and every user that wants to track his way of life in order to optimize it or gain knowledge upon himself can go towards this industry of IoT. It has been proven that, even if the majority of people tend to think that it is hard to build ways of understanding large amounts of data, it is not in fact the case. Software like Tableau are very helpful to build graphical representations and to make statistical inferences applied on the collected data.
The second and main conclusion of this paper was that more data need to be collected to demonstrate the correlation between environmental measurements and television consumption. Even if the indicators for rain showed that a correlation is very probable to exist between the two, the ones for luminosity and temperature failed, mainly because the last week of data.
Another advantage of this paper is that is presents an easy way to show the benefits that sensors can bring. This kind of graphs help the user to see and analyze, without any burden, their way of living. They can be implemented on the Home Assistant interfaces as well and because of the curiosity of the human mind these platforms will be frequently accessed and therefore, their popularity will increase. Also, these kinds of graphs show a potential of future mobile applications that can be connected to the main database and who have as principal objective this behavioral analysis.
Bibliography
- The Effects of Weather on Daily Mood: A Multilevel Approach, Jaap J. A. Denissen
- Internet of things, smart sensors, and pervasive systems: Enabling connected and pervasive healthcare, Pijush Kanti Dutta Pramanik